Friction and wear testing of the C-C composite were performed using a disc-on-disk sliding wear tester, as schematically shown in Fig.1. For this wear tester a unit rev min-1 is equivalent to an average linear speed of 0.055 m/min. The simulated-stop (braking) testing was conducted by first accelerating the rotor specimen to a desired speed (1400 or 2000 rev/min). When the rotor speed was reached, the power of the motor was switched off and, at the same time, the stator specimen was loaded with a pressure of 1.7 Mpa to slide against the rotor until complete stop.
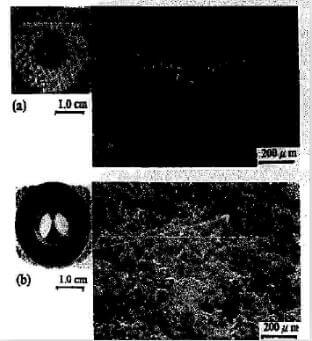
Fig.2-starting-surfaces-for-friction-and-wear-testing
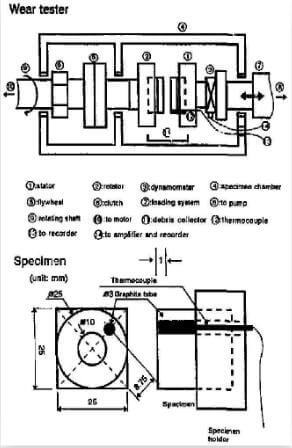
Fig.1-schematic-of-wear-tester-and-specimen-specification
Two different starting surfaces (Fig.2) of the composite were studied and compared. The first group of specimens, designed “AP” (as-polished), were mechanically polished to a level of #1200 grit, followed by ultrasonic cleaning and drying. The second groups of specimens, designated “BI” (broken-in), were the AP specimens followed by a break-in treatment. The AP specimens had an average surface roughness of 1.2 μm, while the BI specimens had a surface roughness of 2.0 μm. The surface morphologies of both will be discussed later. The specimen designation “AP/1400” stands for an AP specimen undergoing a breaking test with an initial speed of 1400 rev/min; “BI/2000” stands for a BI specimen undergoing a breaking test with an initial speed of 2000 rev/min, and so on. The sliding torque used to calculate the friction coefficient was recorded in situ using an AST-BH dynamoneter. Weight loss data were averages of six fresh test runs. Since the rotor and the stator were of identical material, weight losses from both discs were measured and averaged for each run. The temperature induced in the sliding process was measured using a Chromel-Alumel type thermocouple. Through a 3 mm diameter graphite tube, the thermocouple was inserted from the back of the stator to a depth of approximately 1 mm underneath the sliding surface. It should be noted that “actual” temperatures at the very sliding surfaces must be higher than the measured ones. A Hitachi S-2500 scanning electron microscope was used to examine the composite surface before and after wear.
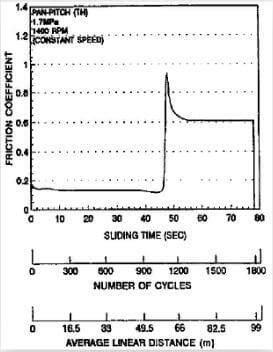
Fig.3-typical-friction-coefficient-variation-during-break-in-process
Results and discussion:
Shown in Fig.3 is typical friction coefficient variation with time during the breaking-in treatment, i.e. the AP specimens underwent a constant speed (1400 rev/min) sliding wear under a load of 1.7 Mpa for 1800 cycles. Prior to the transition occurring at about 46s (or equivalently 1120 cycles or an average linear distance of 61.6m), the friction coefficient was essentially constant, except in the very beginning. When the transition took place, the friction coefficient rose abruptly to 0.93, then quickly declined toward a steady value of about 0.61 until the end of the BI treatment. According to the debris morphology classification of Chen and Ju, thus treated BI specimens had a debris morphology similar to the type Ⅱdebris.
related news /articles:
Friction performance of C/SiC brakes in different environment (8)
Surface effect on braking behavior of PAN-pitch carbon fiber composite(5)
Surface effect on braking behavior of PAN-pitch C-C composite (1)
Surface effect on braking behavior of PAN-pitch C-C composite(3)