The example shown in Fig.4 demonstrated the consistency in the variation of friction coefficient during each braking test under the same condition. Figs. 5-8 represented typical variations of friction coefficient, temperature and sliding speed with braking time for the tests of AP/1400, AP/2000, BI/1400 and BI/2000, respectively. The stopping time under different conditions are compared in Fig.9.
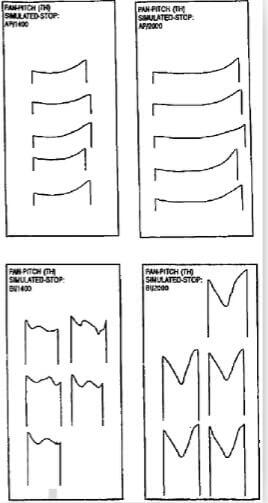
Fig.4-series-of-friction-coefficient-profiles-under-the-same-conditions
As shown in Fig.5(a) (AP/1400), the initial friction coefficient was low (between 0.15 and 0.18). After braking about 10s, the friction coefficient gradually increased. When the rotor completely stopped at 26s, the friction coefficient was increasing, the surface temperature started to decrease due to slowing down of the rotor (Fig.5(b)). During the braking process, the sliding speed decreased quite linearly with time until within the final few seconds, when the rotor slowed down more quickly to a complete stop.
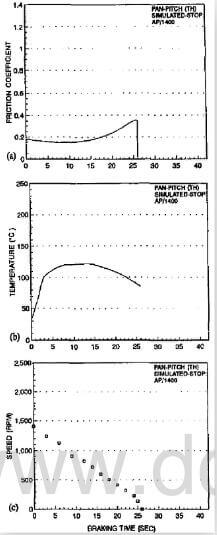
fig.5-typical variations of friction coefficient (a), temperature (b), and speed (c) of AP-1400
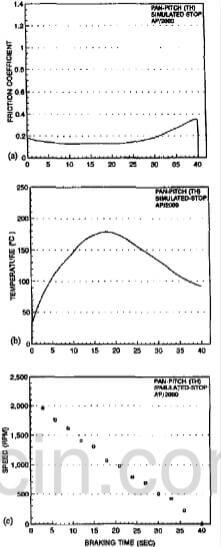
fig.6-typical variations of friction coefficient (a), temperature (b), and speed (c) of AP-2000
The friction behavior of AP/2000 was similar to that of AP/1400, except with a longer low friction duration, longer stopping time and higher peak temperature. Comparison between Fig.5 and Fig.6 indicated that the rise of friction coefficient after about mid-point during braking should not be a result of moisture evaporation due to temperature rise. Had moisture loss been the cause of the rise of friction coefficient, the friction coefficient of AP/2000 should start to rise no later than 10s, when the temperature had already exceeded the peak temperature of AP/1400. However, the rise of friction coefficient of AP/2000 started at about 20s, when the temperature became as high as 180°C. The exact cause for this friction coefficient rise is not certain at this moment.
The friction behavior of BI specimens was remarkably different from that of AP specimens. As shown in Fig.7, the friction coefficient was much higher that that of AP sepcimens, leading to a much shorter times (15s) for a complete stop (Fig.(a)). Despite its shorter sliding time, the peak temperature reached 160°C (Fig.(b)), which is much higher than that of AP/1400 (120°C) due to the much higher friction coefficient. The reduction in speed was essentially in a linear manner with time, except in the first few seconds regime, where a lower reduction rate was observed (Fig.(c)), possibly due to the sharp decrease in friction coefficient in this period.
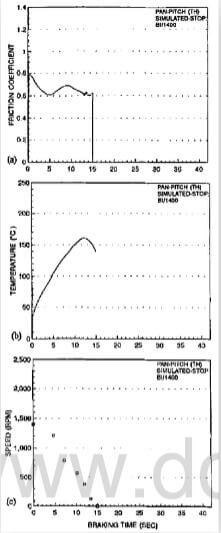
fig.7-typical variations of friction coefficient (a), temperature (b), and speed (c) of AP1400
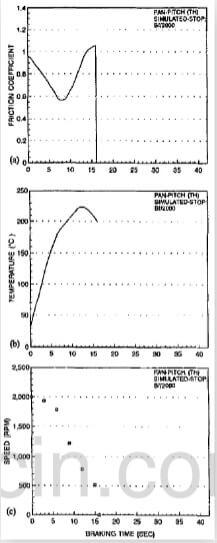
fig.8-typical variations of friction coefficient (a), temperature (b), and speed (c) of BI-2000
As soon as braking started, the friction coefficient immediately rose to 0.78, then declined with time. At 5s it became 0.6, after that the friction coefficient rose again to about 0.7, and then declined again. The way that the fricton coefficient varied could not be interpreted from temperature or speed varation alone, since the temperature started to decline much later, while the speed continued to reduce throughout the test. Within the final few seconds, the friction coefficient was stablized to a value of about 0.6, which is very close to that depicted at the end of the BI treatment.
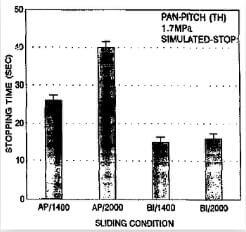
fig.9-stopping times under different conditions
The friction behavior of BI/2000 was different from that of BI/1400 in that it not only exhibited a higher friction coefficient, but also exhibited a different shape in friction coefficient-braking time curves (Fig.8(a)). Again, the friction coefficient variation could not be interpreted only from the variation of temperature (Fig.8(b)) or speed (Fig.(8)). The peak temperature (225°C) was the highest among all test conditions due to its high speed and highest friction coefficient. It is interesting to note that, although with a much higher initl speed, the stopping time of BI/2000 was comparable to that of BI/1400 due to the higher friction coefficient of the former. The speed reduction with braking time of BI/2000 was in a three-stage manner. The deceleration rate was the lowest in the first stag and the highest in the last stage. It seems that this speed variation cannot be explained straightforwardly from the friction coefficient variation curve, as shown in Fig.8(a).