Friction in ambient air: the averaged friction coefficient measurement for each braking stop is presented in Fig.5, including test in ambient air and water spray environment. The variation of friction coefficient will be examined, along with the friction surface topography and microstructure.
As shown in fig.5, the measurement for both C/SiC composite brakes rose from a level of low to high by approximately following a parabolic shape, as braking stop number increased. This characteristic trend at bedding stage was demonstrated in a previous study.
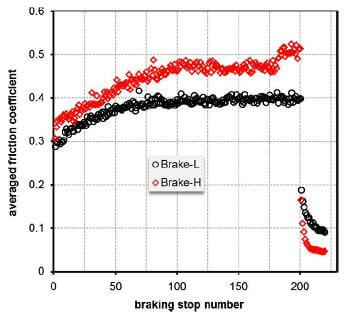
fig.5-average friction coefficient of each braking stop for two ceramic composite brake discs
For Brake-H, the friction coefficient measurement started with a level of ~0.3, followed by a steady ascending to a level around 0.47 after ~100 braking stops. Subsequently, further braking execution had little change of friction coefficient measurement, and a level of ~0.47 was maintained till after 180 executions. From the 181st to 200th, the measurement showed a further, but small rise to another fairly stable level of ~0.51. For Brake-L, a similar ascending trand was observed from the start to the 85th execution, and a stable friction coefficient of ~0.4 was since maintained till the end of test in ambient air.
Based on the observation above, we can phenomenologically describe the variation of averaged friction coefficient, μ versus the braking stop number, n, by using a standard parabolic equation:
μ=an2+bn+c (2)
Where a, b and c are parameters. To quantitatively compare the friction performance of the two composite brakes at the bedding stage, measurements at this stage are fitted to Eq.(2), and parameters a, b and c for each brake are summarised in Table 3. The coordinate of the vertex of a parabola is (167, 0.5) and (115, 0.42) for Brake-H and Brake-L, respectively. The following points can therefore be drawn:
- The μ at vertex represents the friction coefficient level at stable friction. Brake-H gave 19% higher friction coefficient than Brake-L. The predicted CoF ratio between Brake-H and Brake-L is 1.19, which is just inside the ratios of true asymptote shown in Fig.4: 1.18 and 1.28 for the first stable friction coefficient of 0.47 and the second one of 0.51, respectively, for Brake-H.
- Brake-H took 45% more braking stops than brake-L to achieve a stable friction.
It is interesting to see that, when tested against same organic pad materials under same braking conditions, the composite disc that consisted of more than 2 times higher SiC/Si took more braking executions to achieve a stable friction, and likewise provided slightly higher level of friction coefficient, and likewise provided slightly higher level of friction coefficient. Friction force for a friction couple should include the adhesion forces existing on all friction contact regions if the friction is dictated by an adhesion mechanism, and the ploughing resistance if a ploughing process is included. When the friction surfaces are flattened by polishing before test, it should be a reasonable assumption that friction of this friction couple is predominantly dictated by adhesion, and the CoF can therefore be expressed as following equation:
equation 3-CSiC brakes in different environment (4)
Where λ is adhesion force per area of each friction contact region, Si area of each contact region, S nominal area of friction contact interface, and f fraction of total contact regions out of the friction contact interface. Λ ought to be a constant for a given braking condition, f should be a function of braking stop number n at bedding stage, because the number of contact region, m, and the area of each contact region, Si, tend to increase as bedding proceeds. At bedded stage, the friction contact regions become stable, leading to a constant friction coefficient. According to this analysis and the observed ratio of friction coefficient between the two brakes, Brake-H ought to have higher fraction of friction contact region than Brake-L, and the results of friction surface examination are shown below.
related news /articles:
Applications of carbon fiber reinforced composite (3)-airplane brake discs
Friction performance of C/SiC brakes in different environment (7)
Friction performance of C/SiC brakes in different environment (1)
Friction performance of C/SiC brakes in different environment (3)