Fig.5 displays the changes in bulk density and open porosity of G2-1000 after the post-treatment. As can be seen from the figure,
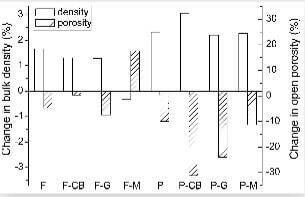
fig.5-changes-in-bulk-density-and-open-porosity-of-composite-after-different-post-treatments
except F-M (furan doped with mesophase pitch), all samples demonstrate an increase in density and a decrease in porosity after the post-treatment. In general, the “P” (pitch)-group samples have larger changes in density and porosity than “F” (furan)-group samples. It is also noted that the change in density/porosity not only depends on the kind of liquid precursor, but also largely depends on the kind of additive-doped liquid precursor. For example, among all additives in P-group samples, P-CB (pitch doped with carbon black) demonstrates the largest increase in density and decrease in porosity after the post-treatment. When doped in furan resin (F-group), however, the carbon black induces the least change in porosity.
The larger changes in density and porosity of pitch-group samples might be explained by their higher densities after graphitization, and higher carbon yields during carbonization leading to less porosity in matrix. In addition, as shown in Table 2, the coal tar pitch used in this study had higher solid content and lower water content than furan resin that might also contribute to the differences in density/porosity.
Effects of the post-treatment on COF and specific wear rate coefficient of G2-1000 are shown in Figs.6 and 7, respectively. As can be
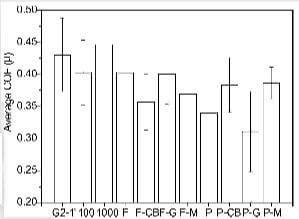
fig.6-average COF values of composite after different post-treatments
seen from the two figures, all samples demonstrate decreases in both COF and wear rate after the post-treatment. The amount of change depends on the kinds of both liquid precursor and additive. While samples P and P-G, respectively, demonstrate lower COF values than samples F and F-G, samples P-CB and P-M, respectively, show higher COF values than F-CB and F-M.
In terms of specific wear rate coefficient, the P-group samples generally exhibit lower wear rate than F-group samples. Particularly interesting among all samples tested are samples P-CB and P-M, which demonstrate the lowest wear rate, while still maintaining relatively high COF values. These results indicate that an appropriate post-treatment, especially a pitch treatment, may dramatically improve the tribological performance of fast-carbonized C/C composites.
Fig.8 shows overall worn surface morphology of post-treated G2-1000. Similar to what described earlier, the worn surfaces of these
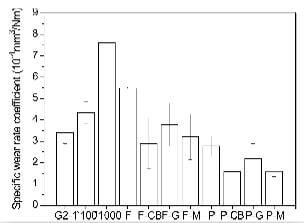
fig.7-specific wear rate coefficient values of composite after different post-treatments
post-treated samples are comprised of both light and dark regions. Compared to untreated G2-1000, the light regions on most post-treated composite surfaces appear significantly larger. Except F-M, the P-group samples generally exhibit larger light regions than F-group samples. Micrographs of higher magnifications again reveal that the dark regions are primarily comprised of powdery debris, while the light regions are comprised of smooth layers of debris. An example is given in Fig.9.
According to Chen and Ju, the layer-type (type Ⅲ) debris is evolved from the type Ⅱ powdery debris beking rolled, compacted and piled-up layer by layer. Due to the weak mechanical bonding among layers, delamination can occur to the debris and fragments of debris break off the surface, transforming into powdery debris again during the continued sliding process. Furthermore, the same study indicates that the layered debris has a better lubricating ability than the powdery debris. This may explain why the friction coefficient and wear of G2-1000 become lower after the post-treatment, especially the pitch treatment. Due to its highly graphitizable nature, after heating to 2200°C, the pitch-derived carbonaceous structure becomes more graphiitic than that derived from resin. In an early study of Longley et al., it was pointed out that the more graphitic carbon was responsible for the lower friction coefficient.
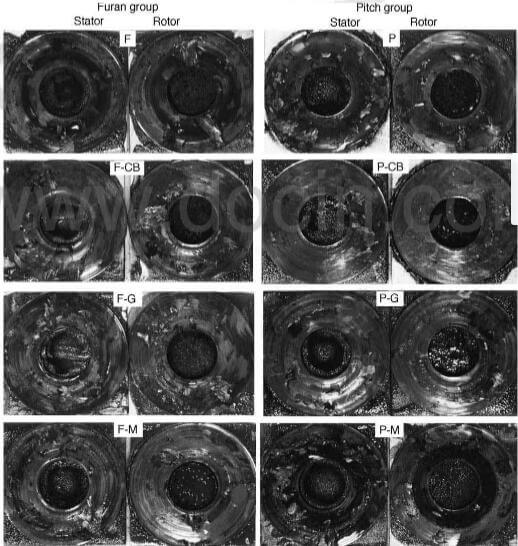
Fig.8-photographs of worn surfaces of composite after different post-treatments
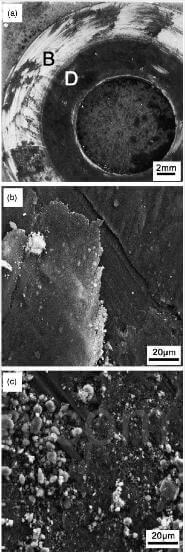
Fig.9-SEM micrographs showing two types of surface debris of sample P-M