Fig.3 shows the microstructure of the same area of initial oxidation of 2D C/C composite. A lot of pits are located at the fiber/matrix interfaces before starting oxidation. Preferential oxidation can be clearly observed at the fiber/matrix interfaces with pits by comparing Fig.3(a) and Fig.3(b). The circumferenctial gaps emerge around the fibers as oxidation proceeds. With the increase of weight loss, the gaps gradually widen and connect one another (Fig.3(c)).
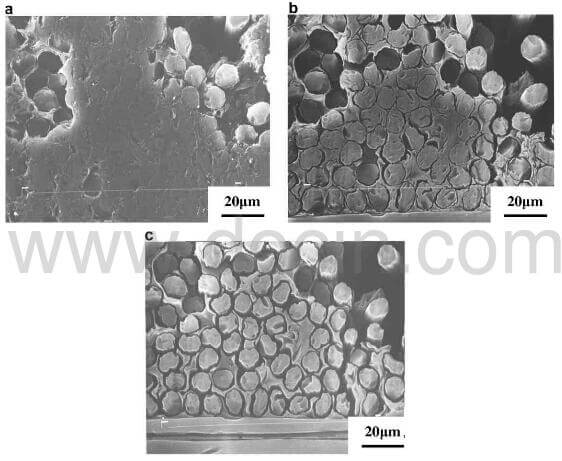
fig.3-processes for the transverse bundle of 2D CC composite
Fig.4 shows SEM micrographs of medium and final stages of oxidation of 2D C/C composite. As can be seen, both carbon fibers and matrix carbon are oxidized simultaneously, but matrix carbon is oxidized much more rapidly than the carbon fibers. With oxidation, the matrix becomes flimsy. The fibers exhibit reduced diameter as compared to the fibers before oxidation, and their ends become sharp. Only the fibers are being attacked in the final stage, where the carbon fibers become much thinner and their ends become needle-like.
Fig.5 shows SEM micrographs of the fibers of different weight loss of 2D C/C composite. The surface of fibers is not smooth, and there are many micro-depressions running parallel to the fiber axes in the middle stage. In the later stage of oxidation, the surface of fibers becomes glossy and the number of micro-depressions decreases.
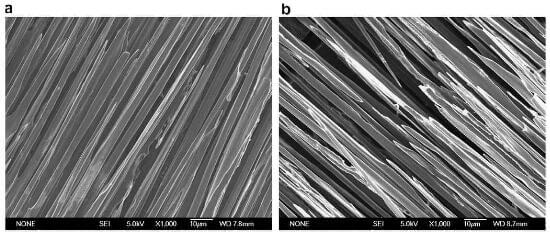
fig.4-microscopical investigation of oxidation processes for the longitudinal bundle of 2D CC composite
Using isothermal oxidation data of 2D C/C composite obtained from Fig.1, the oxidation model-free curve is shown in fig.6. The curve
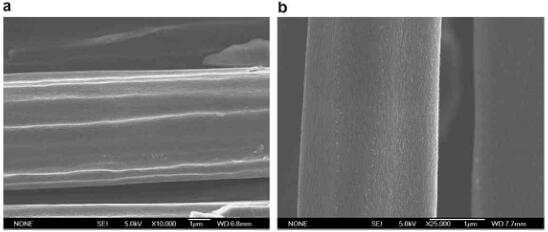
fig.5-microscopical investigation of oxidation processes for carbon fiber of 2D CC composite
is not a single straight line but consists of two straight lines, and the broken point is at about 800-850°C. The oxidation temperatures are divided into two ranges: lower temperatures and higher temperatures. According to Eq.(4), the apparent activation energy was evaluated from the slope of the plot In against T-1. The value of Ex and the coefficient of linear correlation are summarized in table 3.
Fig.7 displays the relationship between Ea and a. The apparent activation energy is relatively high and changes a little at lower temperatures; at higher temperatures, the apparent activation energy changes a little for a<60%, while ascends sharply for a>60%. The difference of the apparent activation energy at lower temperatures and higher temperatures before 60% weight loss is shown in fig.8.
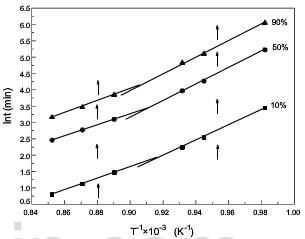
fig.6-the model-free curve of oxidation of 2D CC composite
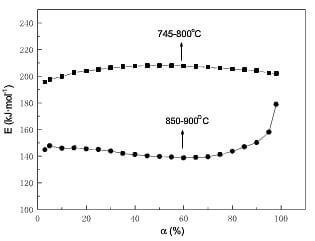
fig.7-dependence of Ea on a for 2D CC composite by model-free method
Arrhenius parameters evaluated for the isothermal experimental data by the model-fitting method are presented in Table 4. The activation energy obtained by model-fitting method is very close to that obtained by model-free method.
The experimental data of reduced time are listed in Table 5. By comparing with Table 2, R2 best fits the experimental results at lower temperatures, but seemingly both R2 and A2 fit the experimental results at higher temperatures. In order to select the exact controlling mechanism from R2 and A2 at higher temperatures, the plot of a with t/t0.5 is presented in Fig.9. As can be seen, R2 best fits the experimental results for a ≤60%, whereas the experimental curves are asymptotic departure from R2 curve and approach to A2 curve for a >60%. Hence, according to the reduced-time plot method, the controlling mechanism is surface reaction in two dimensions for entire process at lower temperatures; at higher temperatures, the controlling mechanism is R2 for a ≤60%, and that are the random nucleation in two dimensions as well as R2 for a >60%.
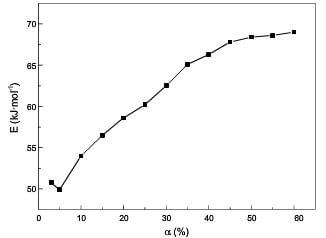
fig.8-the difference of Ea at lower temp and higher temp before 60% burn off by model-free method
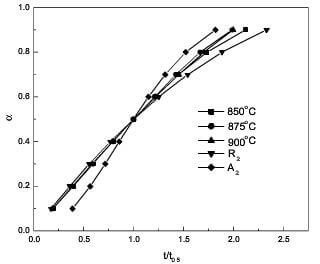
fig.9-experimental a-tt0.5 curves and theoretical a-tt0.5 curves according to R2 and A2