Fig.3 shows TEM images of the interface region between the MT and HT layers. The TEM analysis is performed close to the perforation of the ion-thinned foil. Fig.3a is taken under conventional bright-field conditions where the objective aperture only transmits the beam whereas Fig.3b is a dark-field image. The brigh-field micrograph (Fig.4a) shows that the MT layer appears homogeneous and brigher than the HT layer. Withain the HT layer elongated domains exhibiting different contrast are observed. The typical size of the domains is about 0.5 um * 0.3um. After sample tilting the contrast of such domains is reversed. The indicates that Bragg diffraction contrast plays a dominant role within this sample region. The domain extensions correspond to those of the elongated depressions observed by AFM in the inner HT layer.
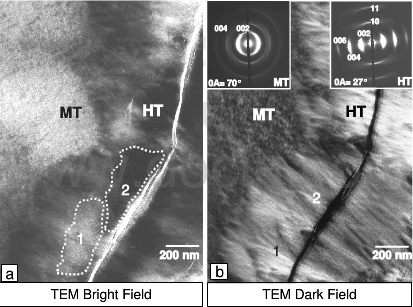
fig.3-microstructure of a TEM foil of the interfacial area between MT and HT layer
The zero-loss filtered SAED patterns, inserted in Fig.3b, illustrate the difference in texture between the MT and the HT layer, which is determined by the degree of preferential orientation of the carbon planes with respect to the fiber surface. The ring-shaped reflections of the MT layer exhibit a considerable azimutal broadening. In contrast, in the case of the HT layer azimutal broadening of the reflections is smaller and reflections of higher order are present indicating a higher degree of texture of the turbostratic basal planes. In addition, finely dispersed grains with a weak contrast are observed in the MT layer. In the domains of the HT layer, smaller elongated grains exhibiting a strong Bragg contrast are visible. Note that the TEM contrast between differently textured layers varies considerably.
Fig.4 shows SEM images of an area of the fracture surface of the C/C composite where the failure took place
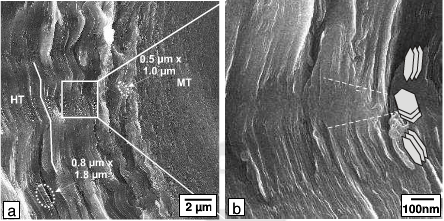
fig.4-SEM micrographs of the fracture surface of the composite
predominately perpendicular to the fiber axis. An intensive fragmentation in the form of zig-zag shaped lamellae parallel to the fiber surface within the HT layer is shown in Fig.4a. The thickness of a lamella lies between 0.5 um and approximately 1 um whereas the average distance between sharp bends in about 1 um. Two typical fragments are marked by dashed ellipses in Fig.4a. Moreover, areas with different roughness can be seen within zig-zag shaped lamella: smooth cone-shaped areas are surrounded by relatively rough areas. Note that such areas are typical for the entire HT layer.