Specimen description: In the present work, a 2D woven C/C composite was investigated. This composite consists of 6000 polyacrilonitrile (PAN) carbon fibers arranged in longitudinal and transverse tows, which are interwoven following a 2-2 direct twill weave pattern to create a single lamina, as shown in Fig.2. The composite was made of 10 of such plies, vacuum densified with phenolic resin as matrix precursor and exposed to a final heat treatment temperature of 1100C.
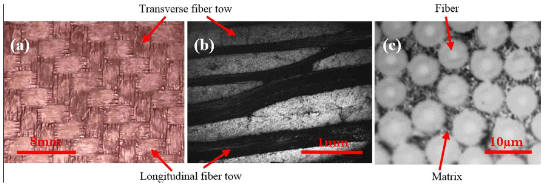
Fig.2-optical micrograph of 2D CC composite (a) top surface (b) cross-section (c) magnified cross-section
The C/C composite plate, with average thickness of 0.2067 ±0.01 inches, using a wet tile saw with a diamond blade. These specimens were grouped according to the thermal shock condition at which they were exposed, and they will be called test specimens throughout this study. Test specimens were hand-abraded using 240, 400, 600, 800 and 1200 grit SiC papers, followed by 6um and 1um diamond abrasives on TEXPAN and ATLANTIS polishing pads, respectively. Finally, the test specimens were polished with 0.05 um alumina on ANPPAD polishing pad for a perfect finish. The microstructure of the test specimens was captured using an optical microscope and a variable-pressure table-to scanning electron microscope. Specimen preparation was performed at room temperature and 1 atmosphere air pressure.
Thermal shock conditions: Pristine test specimens were heated using a heating furnace BF51766-1 Lindberg/Blue M, Thermo Fisher Scientific. Test specimens were placed in a ceramic boat inside the furnace and heated from room temperature to the desired thermal shock temperature at a constant heating rate of 12.5 ± 2C/min. Peak temperatures were reached with a tolerance of ± 2C and the cooling rate ranged from 3 ± 0.5C/min for 400C cycle to 1.6 ± 0.5C/min for 1000C cycle. The cooling rate of the machine was dependent on the peak temperature achieved, and therefore, was solely a limitation of the machine. That is, the total time for an experiment with a peak temperature of 1000C to cool down to room temperature was higher as compared to the one with a peak temperature of 400C. Fig.3(a) and (b) show a constant heating rate up to the peak thermal shock temperatures, while the cooling rate was minimum for the 1000C cycle.
First, five pristine specimens were exposed to five thermal shock conditions, with temperatures of 400C, 600C, 700C, 800C and 1000C, respectively, as shown in Fig.3(a). Thermal shock experiments were performed at room temperature in steady air and 1 atmosphere air pressure. The microstructure of these five thermal shock exposed test specimens was captured before the compression tests using the microscope and the SEM. Then, five test
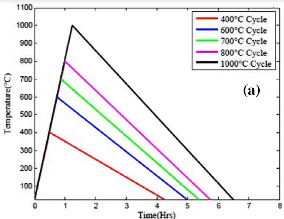
Fig.3(a)-schematic representation of the five different thermal shock conditions (a) one cycle
specimens were exposed to each of the temperatures aforementioned, according to the thermal shock conditions shown in Fig. 3(b) for three cycles. The experimental conditions of the three cycle tests were the same as those for one cycle thermal shock experiments. The microstructure of these test specimens was analyzed before the compression tests, as explained previously, however, since the observed composite oxidation morphology was very similar to that observed on one cycle thermal shock test specimens, an additional test specimen was added to each thermal shock condition in order to analyze the microstructure under the exposed surface. For this purpose only, test specimens were mounted in epoxy, polished and examined using the optical microscope and the SEM.
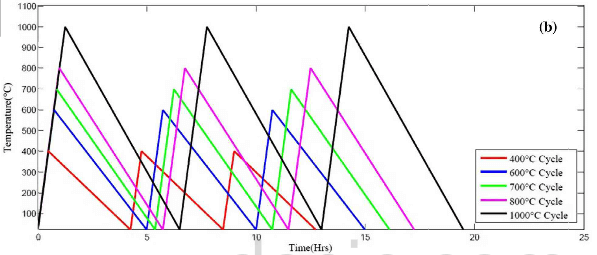
Fig.3(b)-schematic representation of the five different thermal shock conditions (b) three cycles
Compression tests: Five pristine specimens were exposed to through-thickness compression loading to determine the pristine compressive stiffness and strength. Besides this, compression tests were performed on one test specimen for each thermal shock condition and on five specimens exposed to each of the three cycles thermal shock condition. Next, the measured compressive properties were compared with those of the pristine specimens. The stress-strain responses of the pristine and exposed test specimens are shown in the results section. All compression tests discussed in this study were performed at room temperature in steady air and 1 atmosphere air pressure using a servohydraulic fatigue testing system.
The 2D C/C composite compressive properties, i.e., stiffness and strength, were determined by applying compressive load in the through-thickness direction of the composite over the area of the top surface of each specimen. Likewise, the strain was determined from the displacements provided by the crosshead movements with respect to the original average thickness of the composite. Finally, one of the five failed test specimens was mounted in epoxy, polished and examined using the optical microscope and the SEM to capture possible modes of failure.