Figures 16 through 22 contain differential sputter yield data for CC that can be compared to PG data shown in figs.7 through 13. Although there are some subtle differences between the CC and PG data, the overall similarity between the two materials is very high, and the results presented in the figures suggest that the PVD infiltrated and pyro-coated carbon-carbon composite material is virtually identical to pyrolytic graphite in terms of its sputtering behavior.

fig.16-sputter-yield-data-for-CC-composite-bombarded-by-1000-eV-xenon-ions
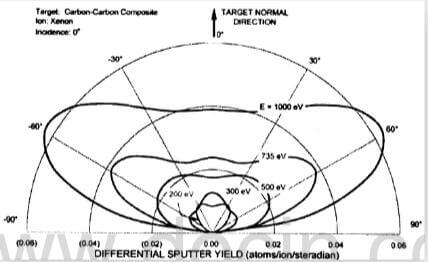
fig.17-sputter yield data for CC composite bombarded at normal incidence
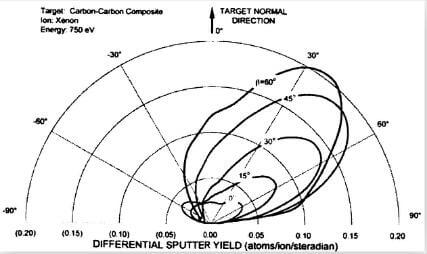
fig.18-sputter yield data for CC composite bombarded by 750 eV xenon ions
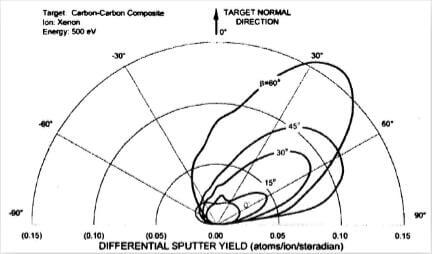
fig.19-sputter yield data for CC composite bombarded by 500 eV xenon ions
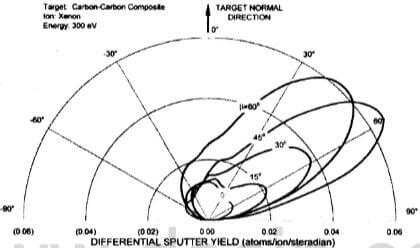
fig.20-sputter yield data for CC composite bombarded by 300 eV xenon ions
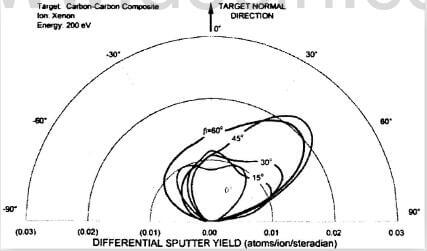
fig.21-sputter yield data for CC composite bombarded by 200 eV xenon ions
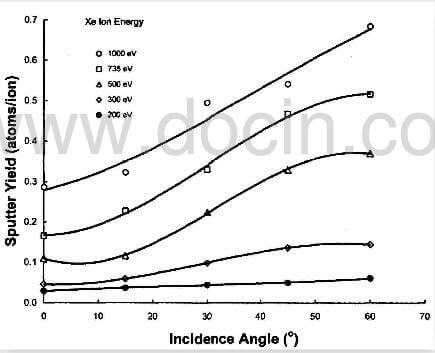
fig.22-CC total sputter yield behavior as a function of incidence angle and ion energy
The easiest way to contrast the PG and CC data sets i through comparisons between figs. (PG) and 22 (CC), which show total sputter yield variation with energy and incidence angle. In general, CC total yields drop off less with incidence angle compared to PG yields. In addition, data collected at 200 eV and 300 eV are easier to distinguish from one another for CC than they are for PG. Table 2 contains a detailed list of the sputter yield data colected on CC, which is formatted similarly to the PG data contained in Table 1.
Similar to the PG sample, it is possible that the sputtering bebavior of the CC surface will change as it becomes highly eroded. In order to check this possibility, we performed temporal experiments where an initially un-exposed CC sample was subjected to the same sputtering conditions over many hours while periodic measurements were made of the differential sputter yield verus trace number. As indicated in the figure, each CC test sequence was followed by a 2 to 3 hr dwell before the measurements were repeated. The sputter yield is shown to be relatively constant at 0.6 atoms/during the entire test. The scatter in the data is about +/- 10%, and it is noted that table 2 lists the sputter yield at 0.5 atoms/ion for the 1000 eV, 30° sputtering condition performed on a separate carbon-carbon sample. The error between measurements on the two CC samples was about 20%.
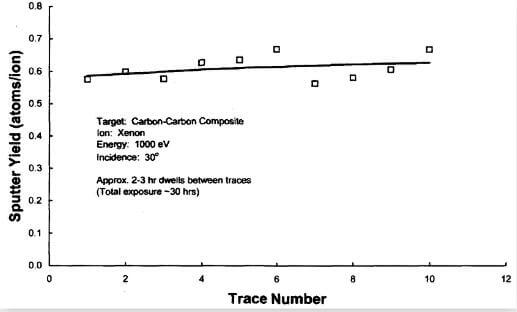
fig.23-temporal dependence of total sputter yield of CC at a xenon ion energy of 1000 eV and 30° incidence
Figure 24 shows xenon sputter data obtained by Rosenberg and Wehner, Deltschew et al., Williams et al., and Doemer et al. on polycrystalline graphite targets at normal incidence. The sputter yield data for graphite are in surprisingly good agreement with one another, and the lower ion energy data of Doemer et al. appear to be in about the right location below the other studies if a line were to be drawn through the various data sets. Predictions from an empirical model of Yamamura and Tawara are also shown in Fig.24 for xenon sputtering of carbon, and it appears that the threshold energy of 161 eV used in the empirical model may be too high to accurately predict the sputtering behavior of graphite at low energies. The PG and CC sputter yield data are observed to fall ~40% below the experimentally measured sputter yield of graphite. It is pointed out that xenon ion sputter yield data collected by Deltschew et al. on carbon-carbon composite material were found to be significantly higher than graphite. However, in contrast to the current study, the composite material characterized be Deltschew et al. was not infiltrated with carbon or pyrolytically coated, and, consequently, the carbon fibers were directly exposed to the ion beam. Deltschew concluded that ions striking the cylindrical fiber surfaces at various incidence angles caused the sputter yield to be higher than graphite.
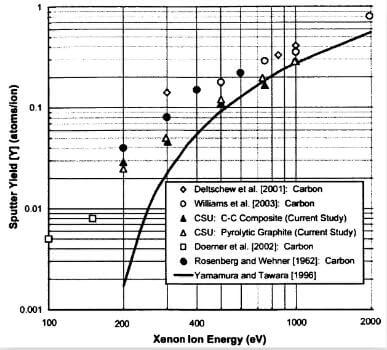
fig.24-comparison of normal sputter yield data for xenon bombardment of different forms of carbon
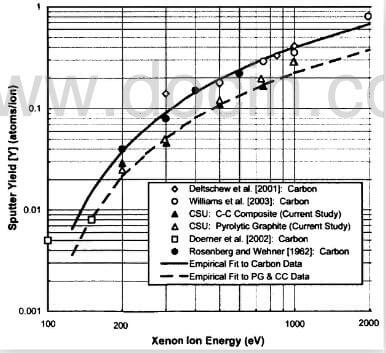
fig.25-new curve fits to sputter yield data for graphite, CC, and PG