Figures 9,10,11 and 12 contain polar plots of differential sputter yield data versus ion incidence angle that were measured at xenon ion energies from 735eV down to 200 eV. In general, the 735 eV data shown in fig.9 behave similarly to the 1000 eV data shown in Fig.7. The most notable differences are that the 735 eV yields are lower and that the 60° incidence data at 735 eV is shifted toward the ion beam.
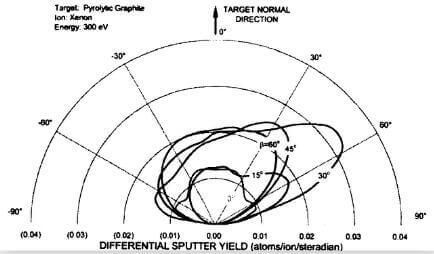
fig.11-sputter yield data for PG bombarded by 300 eV xenon ions
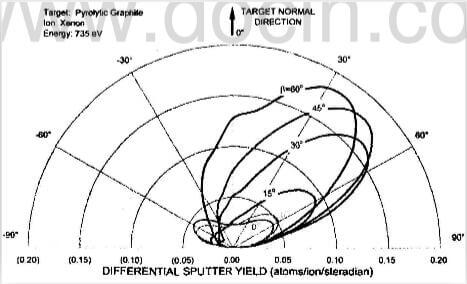
fig.9-sputter-yield-data-for-PG-bombarded-by-735-eV-xenon-ions
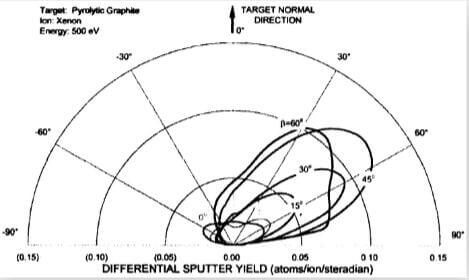
fig.10-sputter yield data for PG bombarded by 500 eV xenon ions
Figure 10 contains data collected at 500 eV. The 0°, 15°, 30°, and 45° data are similar in shape to the 735 eV and 1000 eV data, however, the 60° incidence data drops below the 30° and 45° data in the front-half hemisphere region. It is possible that the 500 eV ions arriving at the target at 60° incidence do not transfer as much energy to near-surface atoms, which are then less effective at excaping from the surface or colliding with other atoms and transferring enough energy to cause the knock-on atoms to escape. This is an interesting result because it suggests that pyrolytic graphite may perform better in highly oblique ion bambarding situations that occur on the accel grid in three-grid ion optics systems for example.
Figures 11 and 12 contain 300 eV and 200 eV polar plots, respectively. As noted earlier, the normal incidence curves appear more cosine-like. This could be due to atoms knocked into high polar angles directions not having enough energy to escape the surface with high probability. In addition, not that fig.11 shows both the 45° and 60° incidence curves falling below the 30° curve in the front half of the hemisphere. Again, this could be due to reduced emission probabilities at high polar angles due to a poor energy transfer situation. In fig.12, the 60° incidence data are shown to increase dramatically in the 30° to +30° region. Although the β=60° distribution appears to be quite large, the total yield in atoms/ion is lower than the 30° distribution, which is caused by geometrical arguments that lead to the sin term in Eq.(5).
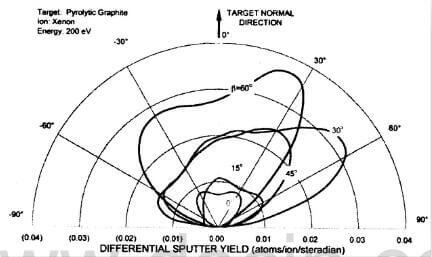
fig.12-sputter yield data for PG bombarded by 200 eV xenon ions
Table 1 contains a detailed list of the sputter yield data collected on pyrolytic graphite. It includes An and Bn coefficients along with total yield estimates obtained using Eq.(9). FIgure 13 contains a plot of total sputter yield data listed in Table 1 versus incidence angle for pyrolytic graphite was bombarded with 200 eV to 1 keV xenon ions. At 1 keV, the sputter yield was observed to increase with incidence angle up to values that were about 2.5 times those measured at normal incidence. As mentioned earlier, it is interesting to note how the total yield of pyrolytic graphite appears to stop increasing with incidence angles above 45° at energies below 735 eV.
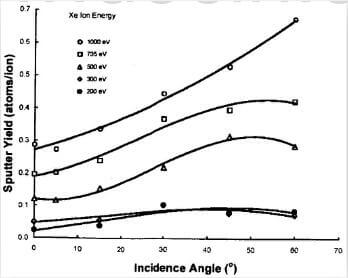
fig.13-PG total sputter yield behavior as a function of incidence angle and ion energy
Photographs taken before and after the sputter testing show very little difference as documented in Fig.14. Note however that all of the samples tested during this program were tested in an as received conditon, and no pretest polishing or cleaning was performed. The roughness of the samples before testing was measured to be ~1.8 μm. It is possible that the sputtering behavior of the surface will change as it becomes highly eroded. In order to check this possibility, we performed temporal experiments where an initially un-exposed pyrolytic graphite sample was subjected to the same sputtering conditions over many hours while periodic measurements were made of the differential sputter yield profile. The results of testing conducted at 1000 eV and 30° incidence are shown in fig.15 as a plot of total yield versus trace number. As indicated in the figure, each test sequence was followed by a 2 to 3 hr sputtering period before the measurements were repeated. The sputter yield is shown to level out near 0.41 atoms/ion after about 6 test sequences. The scatter in the data is about +/- 10%, and it is noted that Table 1 lists the sputter yield at 0.44 atoms/ion for the 1000 eV, 30° sputtering condition performed on a separate pyrolytic graphite sample.
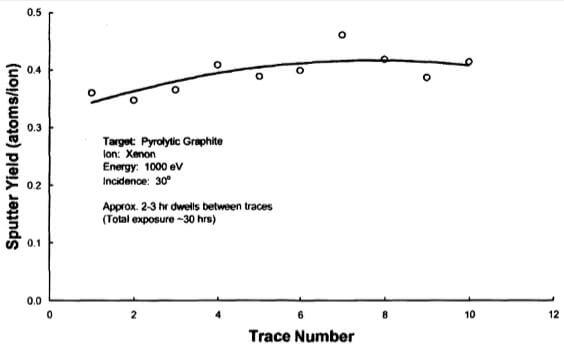
fig.15-results of temporal measurements of PG sputter yields at 1000 eV and 30° incidence