It is possible to obtain the total sputter yield by integrating a function describing the variation in differential yield with α over the full solid angle range through which atoms can be sputtered (2π steradians). For the case of normal incidence, where an axi-symmetric distribution is assumed to exist, the differential solid angle is given by
Eq.(4)
and the total yield is then given by
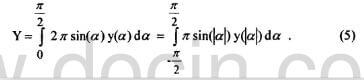
Eq.5
For the normal incidence data in this report, the total yield was determined by fitting differential sputter yield data like those plotted in fig.2 using up to a fifth-order polynomial and performing the integration analytically.
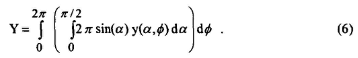
In order to obtain total yield data for non-normal incidence conditions, it would be necessary to measure differential yields over the entire hemisphere above the target and then integrate the equation:
Eq.(6)
However, approximate values of the total yields can be obtained from non-normal incidence yield profiles (like the one for β=30° shown in fig.3) using the far RHS form of Eq.(5) and expressions for each half of the hemisphere located above the target surface. This approximation assumes that the variation in the zaimuthal direction varies smoothly between values measured in the plane formed by the target normal and the ion beam. If the differential sputter yield data are curve-fit using Eqs.(7) and (8) for the front and back halves of the hemisphere located above the target, respectively, the total yield can be found analytically using Eq.(9).
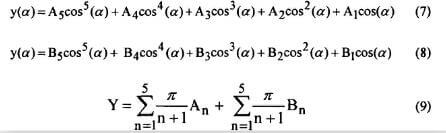
Eq.7.8.9
The curve fits shown in fig.3 for the front and back sputtered distributions were found by plotting the differential sputter yield data
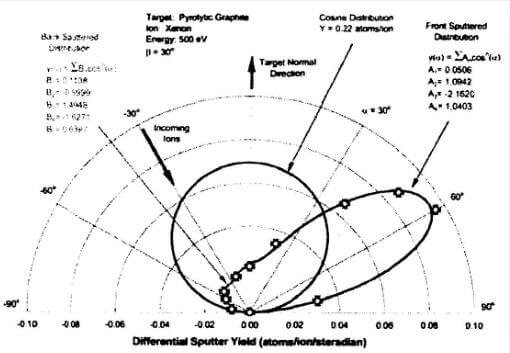
fig.3-differential-sputter-yield-data-measured-at-an-incidence-angle-of-30°-and-ion-energy-of-500-eV
versus the cosine of the polar angle as shown in fig.4. The curve fit values An and Bn shown in figs.3 and 4 can be used in Eq.(9) to estimate the total sputter yield of 0.22 atoms/ion. The cosine distribution curve plotted in figs.3 and 4 for comparison purposes was found uing Eq.(3) assuming a total yield of 0.22 atoms/ion, which was equivalent to the total yield of the measured distribution as found using Eq.(9). The cosine distribution is very different from the measured distribution, and this result reenforces the observation made earlier with normal incidence data that thruster erosion models using cosine emission of sputtered particles are not accurate for predicting sputtering behavior of carbon-based materials.
Although the pyrolytic graphite data show reasonable differential sputter yield patterns at high ion energies, this was not always the case in preliminary tests with combinations of low ion energies and high angles of incidence. We believe this observation is best explained by considering the ion source/target/QCM configuration shown in Fig.5. The black arrow emanating from the ion source represents energetic beam ions that strike the target and sputter material from it. The other arrows pointing at the QCM are discussed below.
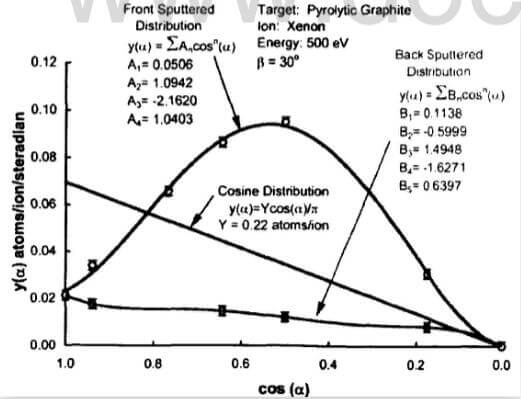
fig.4-standard-representation-of-differential-sputter-yield-data
For preliminary tests at 200 and 300 eV ion energy levels, the original NSTAR-like gridlets used to produce the ion beam were disassembled and re-gapped at a smaller screen-to-accel spacing of 0.26mm. This was necessary to achieve better beam focusing and higher perveance operation for ion energy levels of 200 and 300 eV. At a 60° angle of incidence of the ion beam relative to the target normal, however, we detected high rates of net removal of material from the deposition rate monitor when it was positioned at high positive polar angles, sometimes by an amount greater than the maximum reading observed at any other QCM position. There was no reason to suspect that sputtering of the pyrolytic graphite target was not occuring. Instead, we suspected that material was being sputterd off of the QCM at a greater rate than its carbon accumulation rate. This rate of sputtering of the probe itself increased at the probe was moved closer and closer toward the ion beam axis.
At least three possibilities exist that could explain this effect. The first possibility is that ions “bounce” off the carbon sample and
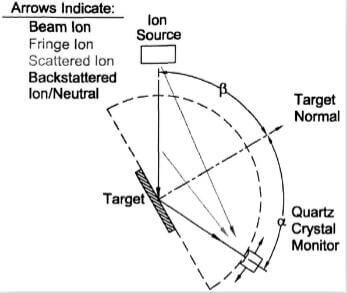
fig.5-orientation-of-target-at-60°-incidence-with-the-QCM-at-120°-relatie-to-the-ion-beam
continue with high kinetic energy toward the probe and sputter it. The sputtering could also be caused by direct impingement of highly divergent ions or by beam ions that are scattered. The fringe ions are those which are not tightly focused into the main beam as they leave the accelerator grid to the extent where they do not strike the target. As a reference to the reader, the fringe ion shown in fig.5 is at 22° relative to the ion beam centerline. Scattered beam ions are created within the entire column of the ion beam when an elastic collision occurs between a beam ion and a neutral atom. In some large angle collisions, the scattered ion or neutral atom can be deflected toward the QC and still retain enough energy to sputter material from the probe.