One important concern during sputter yield measurements is the need for dynamically clean target surfaces. This is because the presence of background gases adsorbed onto the target surface can mask the true sputter yield behavior of the material. A particularly troublesome background gas that is known to affect sputter yields of metals is nitrogen, and the pressure of oxygen ions and excited neutrals can affect sputter yield measurements of carbon and polymer based targets. One can estimate the fraction of the target covered with a background gas using the following equation
Eq.(1)-
In Eq.(1), βn represents the sticking coefficient of a neutral gas atom (n), nn the rate of arrival of neutral particles to the target surface, Yn the sputter yield of an adsorbed atom, and ni the rate of arrival of bombarding ions. As a general rule of thumb, a value of ηn less than 0.1 will ensure that background gases will not affect sputter yield measurements significantly, and, during our experiments, worst case estimates of the background gas shielding effect (ηn) calculated using Eq.(1) were less than 0.05. Another concern for error in ion beam sputtering measurements is the presence of doubly charged ions in the beam because they have twice the energy of singly charged ions and (if they exist in high numbers) can cause measured sputter yields to be higher than actual yields. We operated the ion source at a flow rate that was three times higher than the rate at which ions were extracted from the ion source. For all of the tests described in this paper, the ion source discharge voltage was set to 30V. Very few doubly charged ions where expected at this high flow and relatively low discharge voltage, and measurements made with an ExB probe indicated that the doubles-to-singles concentration ratio was less than 2%.
Measurements made at various polar angles (α) using the QCM provide mass accumulation rates [R(α)] in gm/sec. These can be
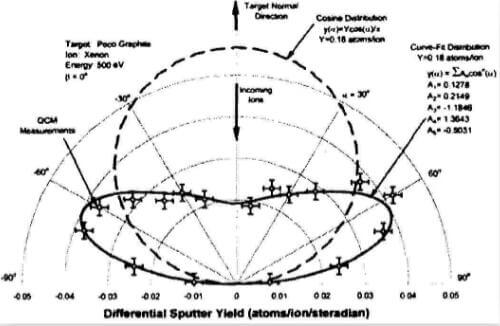
Fig.2-Typical-differential-sputter-yield-data-for-xenon-ions-on-graphite-at-normal-incidence
converted into units of atoms/sec by dividing the mass rates by the molecular mass of the sputtered material (M in gm/mol) and multiplying by Avagadro’s number (NA in atoms/mol). These results are converted into fractional sputter yields by dividing by the ion arrival rate, i.e. by the ion current (J) in coul/sec over the ion charge (q) in coul/ion. However, these yields represent only those atoms sputtered onto the QCM sensor through the solid angle subtended by the sensor from the region of beam impact. Because the sensor is swept through a circular arc and its surface always remains normal to the radius vector this solid angle is the same for each measurement. Assuming the ion impact region is small compared to the arc radius, the solid angle is equal to the sensor area (As) divided by the square of the arc radius (r). Dividing the fractional sputter yields by the solid angle subtended by the sensor gives angle-dependent differential sputter yields [y(α)]. The equation for differential sputter yield in atoms/ion/steradian developed as it has been described above is:
Equotion.2-
Typical differential sputter yield data obtained for 500 eV xenon ions sputtering PoCo graphite at a beam current of 11 mA are shown in Fig.2 in a polar plot format. The constants needed in Eq.(1) to convert raw rate data [R(α)] into differential yield data for this figure are:
NA=6.023*1023 atoms/mol q=1.6*10-19 coul/ion r=17.8 cm
M=12 gm/mol (carbon) J=11*10-3 coul/sec As=0.535 cm2
The data plotted in Fig.2 correspond to QCM measurements that were converted using Eq.(2), and the error bars are estimates based on the resolution of the QCM readout and the choice of the sample time. The differential sputter yield profile was observed to be fairly flat with a majority of material sputtered at high polar angles. This same behavior was observed with PG and CC targets and is expected when heavy particles like xenon are directed at targets comprised of light atoms like carbon. The dashed curve shown in Fig.2 represents a cosine distribution that corresponds to the same total sputter yield as the curve fit to the data. Although the cosine distribution appears to be much larger than the measured distribution, the total yield measured in atoms/ion is the same. This is due to geometrical arguments presented below. Cosine distributions are commonly assumed in most wear models of electric propulsion devices. This distribution was included on fig.2 to make the point that actual sputtering behavior can be dramatically different than ideal behavior assumed in models where cosine distributions are used. Ths cosine distributions were calculated from values of total yield given in equations below and the diffuse emission equation given by Mhan:
Eq.(3)-