In this paper, we first present a description of our measurement technique. This section is followed by a presentation of data that has been collected on PG and C/C targets. In addition to experimental data, curve fit cefficients for differential sputter yields are listed in tabular form. Finally, the measurements on PG and C/C are compared to measurements made by other researcers.
Differential sputter yield testing was performed by first attaching the PG and C/C targets to a water-cooled mounting plate in a vacuum
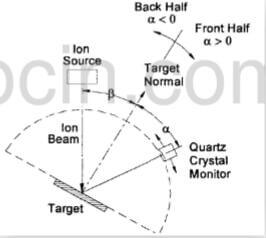
Fig.1-Sketch-of-test-apparatus
system. The vacuum system was then evacuated and baked to ensure the best possible vacuum conditions. No-flow pressures below 1*10-6 Torr were achieved before sputter testing was initiated. The basic test apparatus, which is shown schematically in Fig.1, includes an ion source equipped with a well-focused, 2.5-cm diameter ion optics system. The ion beam is directe onto the cente of the target surface, which is located 23 cm downstream of the ion source grids. This target surface, which is large compared to the beam size, can be rotated to change the angle of incidence of the beam. For this study, incidence angles were varied from β=0° to β=60°.
Sputtered material was sensed as a mass accumulation rate by the quartz crystal monitor (QCM), which is also shown in the Fig.1. The QCM was mounted on an arm that rotated about the same axis as the one used for target rotation. The QCM sensor was swept on an arc that was 17.8cm in radius and was oriented so its sensing face remained pointed at the midpoint of the ion beam impact zone as suggested in Fig.1. Mass accumulation rates were typically measured over the atom ejection angle (α) range from α=-90° to α=+90° relative to the target surface normal vector in 10° to 20° increments. The polar angle range from 0 to +90 is referred to as the front half of the hemisphere located above the target, and the range from -90 to 0 is referred to as the back half. Material sputtered in the forward direction is detected in the front half of the hemisphere and material sputtered backward is detected in the back half of the hemisphere. It is noted that QCM measurements were not made at positions where the monitor would intercept the ion beam.
QCM data were obtained as changes in mass on the QCM crystal over prescribed intervals of time at each QCM position. Data collection was repeated as necessary to assure the mass accumulation rate had reached a stable value before final measurements were recorded. During data collection, the total and partial pressures within the vacuum facility were monitored in nitrogen equivalent units using a residual gas analyzer (RGA). The total pressure was typically in the low 10-5 Torr range and xenon was the dominant gas in the chamber at a nitrogen equivalent partial pressure that was very close to the total pressure. Nitrogen was the dominant impurity present during data collection at a partial pressure that was a few percent of the total pressure. Other impurities that were present during data collection were at an order of magnitude lower partial pressure and included oxygen, water vapor, and hydrogen.