In the Fig.5 inset we show the conductance map showing a bright current streak appearing on the top layer edge as indicated by an arrow. This observation indicates clearly the presence of two distinct types of edges on this graphite ribbons. This is more illustrative in the line profiles of the conductance current shown in Fig.5 of the lines marked A and B in the Fig.5 inset. The current at the edge showing a bright streak is two to four times the value measured on the terrace. In this case, the lower layer near the step edge does not show a dip in the conductance/current as observed earlier. It appears that the high electron density at the edge of the top layer has compensated for the deficient electron density of the lower layer near the top layer edge.
In Fig.6(a), the region marked as Ⅰand Ⅱ are on the top of region marked Ⅲ. We show the local conductance map for the forward bias condition. We see a brighter shade for region Ⅰ than for region Ⅱ for the forward bias condition, even though both sheets are monolayers and on top of the same sheet Ⅲ. This may imply that the interlayer bonding for layers Ⅰ and Ⅱ with layer Ⅲ are different. Another interesting feature we observe is that the bright streak abruptly ends along some edges as shown by an arrow in Fig.6(b). This indicates that the edge can be of two different types on the same side of a single ribbon/sheet. Recently it has been shown by atomic resolution STM imaging, the structure of graphene edges on HOPG containing both the type of edges on the same side of the edge. Since in the present investigation a metal coated AFM tip was used, high resolution atomic imaging of the edge was not possible. In Fig.6(b) we show the current profile along the lines marked in Fig.6(a) for forward bias condition.
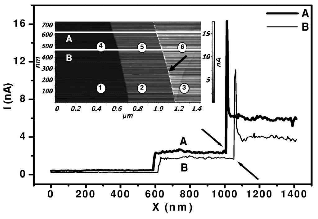
Fig.5-inset shows conductance map
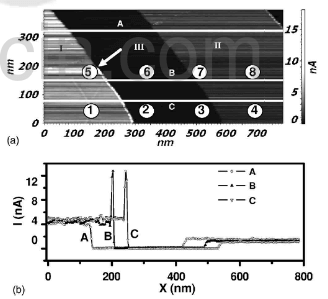
Fig.6-(a)local conductance map (b)the current profile along the lines marked in (a)
We have also performed current-voltage measurement on these sheets as shown in Figs.7(a) and 7(b) at various regions of ribbons/terraces marked in the Fig.5 inset and in Fig.6(a), respectively. We clearly see that the ribbons which are bright in the forward bias condition in the local conductance images show a large slope in the Ⅰ–Ⅴ measurement at zero bias. The intermediate conductance ribbons show intermediate slopes and the least conductance ribbons show the
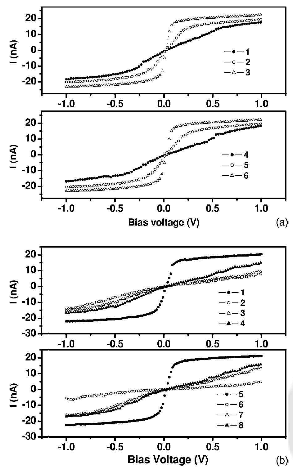
Fig.7-current-voltage measurement carried out at various regions
lowest slope value. As we have pointed out earlier, the normal force FN of the tip on the sample was kept constant during the imaging and during the Ⅰ–Ⅴ measurements and hence the measured conductance is only due to the local conductivity. Thus the conductance map and the Ⅰ–Ⅴ measurements indicates that the ribbons/sheets which are dislodged or sheared have more conductivity than the sheets which held with the bulk.
We now summarize the main observations of this study:
- Variation of conductance among the graphite ribbons on the surface of HOPG. The top layer always exhibits more conductance than the lower layers.
- Two different monolayer ribbons on top of the same graphite sheet shows different conductanct.
- Certain ribbon/sheet edges show sharp rise in current
- Certain ribbons/sheets on the same edge shows both presence and absence of the sharp rise in the current.
- Some lower layers at the interface near a step edge show a strange dip in the current conductance.
We will discuss the implications of the above observations in the next section.