Following the experimental procedure explained previously, stress-strain responses for pristine and thermal shock exposed specimens were obtained. Stress-strain responses of test specimens exposed to one and three cycles of thermal shock configurations are shown in Fig.11(b) to (f). It was verified that the compressive stiffness was lower for three cycle thermal shock conditions as compared to one cycle. The average compressive stiffness and strength of pristine 2D C/C composite specimens were determined to be 1.7 ± 0.14 Gpa and 140 ± 15 MPa, respectively. The strength values were obtained from the stress-strain responses, at a point where the composite started displaying damage induced non-linearity. Through-thickness stress-strain responses of pristine specimens displayed a brittle type of failure, as shown in Fig.11(a). Similar behavior was found in the responses of test specimens exposed to one cycle of thermal shock, which are shown by a dashed line in Fig.11(b) to (f).
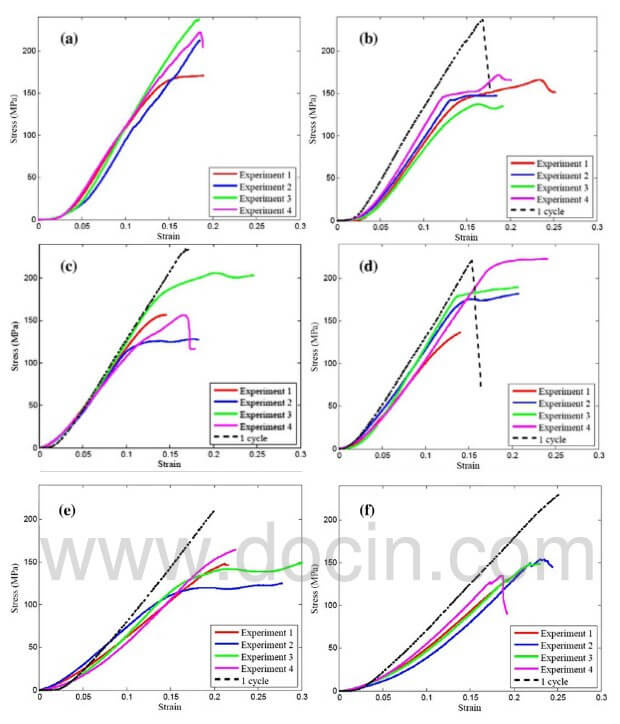
Fig.11-stress-strain responses of 2D CC composite test specimens
The compressive stiffness and damage induced non-linearity for all cases, i.e., pristine, 1 cycle exposure and 3 cycle exposure are summarized in Fig.12(a) and (b) respectively. Fig.12(a) provides a good comparison of stiffness reduction with increasing thermal shock peak temperature, which was obtained by focusing at the initial slopes of the stress-strain responses. Likewise, damage induced non-linearity was observed in the compressive response of test specimens exposed to three cycles of thermal shock, showing a decrease in the average onset strength with increasing thermal shock peak temperature. These average strength values are summarized in Fig.12(b) showing a good agreement between repeated tests.
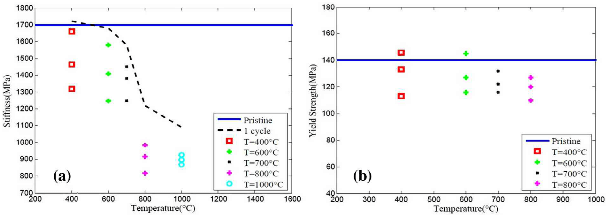
Fig.12-comparison of compressive stiffness and yield strength of 2D CC composite specimens.
Microstructural analyses of test specimens subjected to compression tests after being exposed to three cycles of thermal shock were performed. The edge and the interior right under the exposed surfaces of the test specimens were studied by optical micrographs and SEM images, respectively. The examination of the edge of test specimens showed that fracture occurred by shear type failure between plies that run perpendicular to the applied load, as
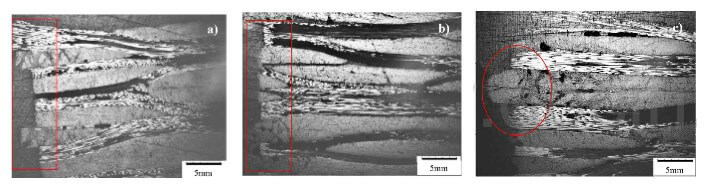
Fig.13-optical micrograph of polished 2D CC composite
shown in red in Fig.13 (a) to (c) and Fig. 14. Also, as explained by Bacos, matrix oxidation led to crack/void growth and tow/matrix degradation within the interior of the composite resulting in matrix/tow debonding that highly influenced the compressive mechanical response of the composite. Therefore, these oxidation mechanisms supported the propagation of matrix cracks, tow/matrix debonding and/or fiber tow breakage within the composite under lateral compression, causing the complete failure of the composite. Pristine and 400C test
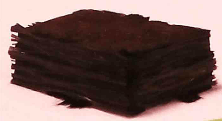
Fig.14-700 C 2D CC composite after compression test showing shear mode failure
specimens followed a brittle type failure and shear banding occurred within the first layers of the composite, whereas test specimens exposed to high temperatures, i.e., greater than 700C, followed a compliant failure as the aforementioned oxidation mechanisms supported the creation of multiple shear banding zones through the thickness of the composite. This latter behavior is attributed to damage induced non-linearity prior to the complete failure of the composite.